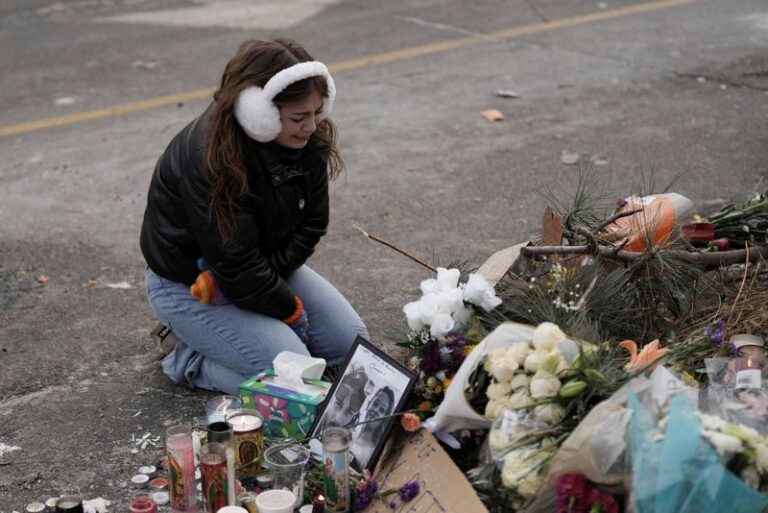
Federal officials dig in on Minneapolis shooting narrative despite video evidence
Widespread Power Outages and Flight Cancellations Caused by US Storm | Weather News
From Texas to New England, the monster storm brings hazardous conditions, prompting warnings to stay off roads.
Nearly a million customers across the United States are without electricity and more than 10,000 flights have been cancelled as a monster winter storm threatens to paralyse a large part of the country with heavy snowfall and freezing rain.
The storm is forecast to sweep the eastern two-thirds of the nation on Sunday and into the week, plummeting temperatures to below freezing and causing “dangerous travel and infrastructure impacts” to linger for several days, the National Weather Service (NWS) said.
Recommended Stories
list of 3 itemsend of list
As of 10:47 am EST (15:47 GMT) on Sunday, more than 850,000 customers were without electricity, according to PowerOutage.us, with at least 290,000 in Tennessee and over 100,000 each in Mississippi, Texas and Louisiana. Other states affected included Kentucky, Georgia, Virginia and Alabama.
Heavy snow was forecast from the Ohio Valley to the Northeast, while “catastrophic ice accumulation” threatened from the Lower Mississippi Valley to the Mid-Atlantic and Southeast.
“It is a unique storm in the sense that it is so widespread,” said NWS meteorologist Allison Santorelli, adding that about 213 million people were under some sort of winter weather warning.
“It was affecting areas all the way from New Mexico, Texas, all the way into New England, so we are talking like a 2,000-mile [3,220km] spread.”
Calling the storm “historic”, US President Donald Trump on Saturday approved federal emergency disaster declarations as nearly 20 states and the District of Columbia declared weather emergencies.
“We will continue to monitor, and stay in touch with all States in the path of this storm. Stay Safe, and Stay Warm,” Trump wrote in a post on Truth Social.
More than 10,000 flights were cancelled on Sunday and another 8,000 have been delayed, according to the flight tracker FlightAware.com. Major US airlines warned passengers to stay alert for abrupt flight changes and cancellations.
The Federal Emergency Management Agency pre-positioned commodities, staff and search-and-rescue teams in numerous states, Department of Homeland Security Secretary Kristi Noem said, warning Americans to take precautions.
“It’s going to be very, very cold. So we would encourage everybody to stock up on fuel, stock up on food, and we will get through this together,” Noem said. “We have utility crews that are working to restore that as quick as possible.”
The Department of Energy on Sunday issued an emergency order to authorise grid operator PJM Interconnection to run “specified resources” in the mid-Atlantic region, regardless of limits due to state laws or environmental permits.
The NWS warned that heavy ice could cause “long-duration power outages, extensive tree damage, and extremely dangerous or impassable travel conditions”, including in many states less accustomed to intense winter weather.
Authorities warned of life-threatening cold that could last a week post-storm, especially in the Northern Plains and Upper Midwest, where wind chill lows were forecast to dip to extremes under -50F (-45C). Such temperatures can cause frostbite within minutes.
The massive storm system is the result of a stretched polar vortex, an Arctic region of cold, low-pressure air that normally forms a relatively compact, circular system but sometimes morphs into a more oval shape, sending cold air spilling across a large region, in this case, North America.
Scientists say the increasing frequency of such disruptions of the polar vortex may be linked to climate change.
Footage reveals man fatally shot by immigration agents was unarmed and holding a phone, contradicting official statements
Videos quickly emerged showing the fatal shooting of a Minneapolis protester by a Border Patrol agent that has been widely denounced as a case of excessive force carried out by untrained federal officers. The administration says it was a case of an armed man provoking violence.
The Associated Press reviewed multiple bystander videos that show a Border Patrol agent shooting and killing 37-year-old Alex Pretti after a roughly 30-second scuffle around 9 a.m. Saturday. The videos appear to contradict statements by the Trump administration, which said the shots were fired “defensively” against Pretti as he “approached” them with a gun.
In the videos, Pretti is seen with only a phone in his hand. None of the footage appears to show him with a weapon. During the scuffle, agents discovered that he was carrying a 9 mm semiautomatic handgun, and they opened fire with several shots. Pretti was licensed to carry a concealed weapon.
Minneapolis Mayor Jacob Frey, who said he watched one of the videos, said he saw “more than six masked agents pummeling one of our constituents, shooting him to death.” Frey has said Minneapolis and St. Paul are being “invaded” by the administration’s largest immigration crackdown, dubbed Operation Metro Surge.
Homeland Security Secretary Kristi Noem said Pretti attacked officers, and Customs and Border Patrol Commander Gregory Bovino said Pretti wanted to do “maximum damage and massacre law enforcement.” In posts on X, President Donald Trump’s deputy chief of staff, Stephen Miller, called Pretti “a would-be assassin.”
It was the second fatal shooting in Minneapolis by federal immigration authorities this month. The first, on Jan. 7, involved Renee Good. It also was captured on videos and produced a similar schism among political leaders.
The shooting occurred when officers were pursuing a man in the country illegally wanted for domestic assault, Bovino said. Protesters routinely try to disrupt such operations, and they sounded high-pitched whistles, honked horns and yelled at officers.
Among them was Pretti. At one point, in a video obtained by AP, Pretti is standing in the street and holding up his phone. He is face-to-face with an officer in a tactical vest, who places his hand on Pretti and pushes him toward the sidewalk.
Pretti is talking to the officer, though it is not clear what he is saying.
The video shows protesters wandering in and out of the street as officers persist in trying to keep them at bay. One protester is put in handcuffs. Some officers are carrying pepper spray canisters.
Pretti comes in again when the video shows an officer wearing tactical gear shoving a protester. The protester, who is wearing a skirt over black tights and holding a water bottle, reaches out for Pretti.
The same officer shoves Pretti in his chest, leading Pretti and the other protester to stumble backward.
A different video then shows Pretti moving toward another protester, who falls over after being shoved by the same officer. Pretti moves between the protester and the officer, reaching his arms out toward the officer.
The officer deploys pepper spray, and Pretti raises his hand and turns his face. The officer grabs Pretti’s hand to bring it behind his back, deploys the pepper spray canister again and then pushes Pretti away.
Seconds later, at least a half-dozen federal officers surround Pretti, who is wrestled to the ground and hit several times. Several agents try to bring Pretti’s arms behind his back, and he struggles.
Videos show an officer, who is hovering over the scuffle with his right hand on Pretti’s back, backs away from the group with what appears to be a gun in his right hand just before the first shot.
Someone shouts “gun, gun.” It is not clear if that’s a reference to the weapon authorities say Pretti had.
And then the first shot is heard.
Videos do not clearly show who fired the first shot. In one video, seconds before the first shot, one officer reaches for his belt and appears to draw his gun. That same officer is seen with a gun to Pretti’s back as three more shots ring out. Pretti slumps to the ground. Videos show the officers backing away, some with guns drawn. More shots are fired.
The Department of Homeland Security said Pretti was shot after he “approached” Border Patrol officers with a gun. Officials did not say if Pretti brandished the weapon or kept it hidden.
An agency statement said officers fired “defensive shots” after Pretti “violently resisted” officers tried to disarm him.
Walz expressed dismay at the characterization.
“I’ve seen the videos, from several angles, and it’s sickening,” he said.
Trump weighed in on social media by lashing out Walz and Frey. Trump shared images of the gun that immigration officials said was recovered from Pretti and said “What is that all about? Where are the local Police? Why weren’t they allowed to protect ICE Officers?”
This story was originally featured on Fortune.com
Generals-backed party poised for overwhelming victory in ‘fraudulent’ Myanmar election
Polls in Myanmar have closed after a third and final stage of voting in what are widely viewed as sham elections.
Many popular parties are banned from standing and voting has not been possible in large areas of the country because of a five-year-long civil war.
The dominant party backed by the ruling military junta is expected to win a landslide victory.
The current regime has rejected international criticism of the election, maintaining that it is free and fair.
Around one-fifth of the country’s 330 townships, including the cities of Yangon and Mandalay, voted in the last stage.
Six parties, including the military-backed Union Solidarity and Development Party (USDP), fielded candidates nationwide, while another 51 parties and independent candidates decided to contest state and regional levels.
Two previous rounds were held on 28 December and 11 January – giving overwhelming victories to the USDP.
The party won only 6% of parliamentary seats in the last free election in 2020.
As in previous rounds of this strange, month-long election, voting was orderly and peaceful at the polling station in Nyaungshwe, Shan State, which a BBC team observed.
Set in a large school, shaded by huge rain trees, there were ample volunteers an officials to guide voters where to go, and how to make their choice using the new, locally-made electronic voting machines.
You could be forgiven for believing this was a normal democratic exercise, not the sham its critics say it is.
However polling day was preceded by a campaigning period marked by fear, intimidation and a pervasive sense that little will change after the inevitable victory by the USDP.
Everywhere the BBC team travelled in southern Shan State, we were followed and closely monitored by dozens of police and military officials, always polite but very persistent.
It proved nearly impossible to get people to say anything about the vote, so nervous were they of possible repercussions.
The next steps after final results are announced are laid down in the military-drafted constitution.
Parliament will meet within the next two months to choose a new president, and everyone expects that to be the coup leader Gen Min Aung Hlaing.
It will be the same regime with civilian clothes.
But he will then have to relinquish his command of the armed forces.
His replacement is certain to be a loyalist, but his hold over the ranks of the military will inevitably be less secure, and it is no secret that many other senior officers do not believe he has made a good job of leading the country.
With many more voices in politics, there is the possibility of wider debate inside government over which direction Myanmar should now take, and the possibility – distant for now – of the first steps towards ending the civil war.
The military junta took control of Myanmar in a 2021 coup, ousting an elected civilian government led by Nobel Peace Prize Winner Aung San Suu Kyi.
She remains in detention and, like many other opposition groups, her National League for Democracy has been formally dissolved.
The military has been fighting against both armed resistance groups which oppose the coup and ethnic armies that have their own militias.
It lost control of large parts of the country in a series of major setbacks, but clawed back territory this year enabled by support from China and Russia.
The civil war has killed thousands of people, displaced millions more, destroyed the economy and left a humanitarian vacuum.
A devastating earthquake in March and international funding cuts have made the situation far worse.
Record-breaking 12.8 million users tune in to Roblox concert featuring Bruno Mars
Bruno Mars has continued his record-breaking streak after drawing more than 12.8 million concurrent users to his virtual concert on Roblox.
The 16x Grammy winner set a new single artist record for most watched virtual concert with his performance on the platform’s Steal a Brainrot video game on Saturday (January 17).
The feat came on the heels of Mars selling 2.1 million tickets in a single day for his upcoming stadium tour, breaking records and logging the highest single-day sales in Live Nation history across North America, Europe and the UK.
The on-sale also set a new Ticketmaster record for the most tickets sold in a single day.
Mars became the first ever artist to ‘pop up’ in the viral Steal a Brainrot experience, which sees players raid each other’s bases to capture in-game characters known as ‘Brainrots’.
Fans were given the chance to collect Bruno-themed traits and a limited edition “Brunito Marsito” Brainrot.
The concert peaked with 12,862,161 concurrent users, according to the platform, attaining 53 million-plus views from social video content originating from more than 38 countries and in 20 languages.
Over 10 million viewers watched livestreams from 14 countries in nine languages.
Mars was previously named as the “icon” for Epic Games‘ Fortnite Festival Season 9 last year, capping off the Season 8 Festival with Sabrina Carpenter.
Other major artists to have been featured as “icons” on Fortnite include The Weeknd, Lady Gaga, Billie Eilish, Metallica, Karol G, Snoop Dogg, and Hatsune Miku.
DJ star Marshmello famously played the first ever live virtual concert inside of Fortnite back in 2019, attracting over 10 million concurrent users.
Rapper Travis Scott went on to break that record the following year, pulling in 12.3 million concurrent players for his Astronomical virtual performance.
That bar stood until Fortnite set a new milestone in November 2024, drawing 14.3 million concurrent players for its Remix: The Finale virtual concert, which featured performances by Snoop Dogg, Ice Spice, Eminem, and a posthumous tribute to Juice WRLD.
Roblox finished Q3 2025 (to end of September) with a significant spike in Daily Active Users (DAUs).
At the close of that quarter – the latest on public record – the firm counted 151.5 million DAUS globally.
That was up 70% YoY vs. the equivalent period of the prior year (see below).
Over 90 million of those DAUs in Q3 2025 were located outside of the US, Canada, and Europe.

Music Business Worldwide
Many arrested in solidarity with Palestine hunger strikers outside London prison | Latest on Israel-Palestine conflict
Eighty-six people have been arrested in the United Kingdom after gathering at a London prison in support of a Palestine Action-linked activist on hunger strike and in a perilous condition who is being held there, police say.
London’s Metropolitan Police wrote on X late on Saturday that officers were dispatched to Prison Wormwood Scrubs, where protesters “refused to leave the grounds when ordered to do so”.
Recommended Stories
list of 4 itemsend of list
Inside Wormwood Scrubs is Umer Khalid, a 22-year-old pro-Palestine activist who stopped eating 16 days ago. He had been on hunger strike since November, briefly pausing in December due to severe ill health.
The group “allegedly blocked prison staff from entering and leaving, threatened police officers and a number managed to get inside a staff entrance area of a prison building”, the police said.
Videos of the incident verified by Al Jazeera show police officers shoving protesters to the ground and handcuffing them as shouts ring out in the background. Two groups of police also appeared to kettle protesters – a police tactic that involves officers surrounding and closing in on a group of demonstrators in an effort to contain them.
“Why are you assaulting me?” a woman can be heard asking at one point.
Those arrested were detained under suspicion of aggravated trespass, the police said.
Khalid told Al Jazeera last week that he planned to escalate his hunger strike to exclude all fluids starting on Saturday, the day of the protest.
After speaking with him on Monday by phone, Khalid’s mother, Shabana Khalid, told Al Jazeera that a prison guard remains outside his cell in case he needs urgent medical attention. She added that he is also being monitored closely with hourly medical observations.
“I’m reassured in one sense,” she said, “but the fact he’s on [hunger strike] still is quite scary. He’s starting to get tired. You can hear in his voice.”
Umer Khalid is among a group of five activists accused of breaking into the United Kingdom’s largest airbase, Brize Norton, in Oxfordshire in June and spray-painting two Voyager refuelling and transport planes. The group has pleaded not guilty.
At the time, the pro-Palestine protest group Palestine Action said two of its members were involved and red paint “symbolising Palestinian bloodshed was also sprayed across the runway and a Palestine flag was left on the scene”.
Within days, the UK government moved to ban the group under “antiterrorism” laws and made it illegal to support or promote the group.
The decision – which has been challenged in court and heavily criticised as “unjustified” by the United Nations – has led to multiple protests with hundreds of arrests in the months since.
Ongoing hunger strikes
Aside from Umer Khalid, seven other protesters have been involved in rolling hunger strikes since November.
Khalid became the only one still refusing food after three members of the group ended their protests this month. They said one of their demands had been met after a UK-based subsidiary of the Israeli weapons company Elbit Systems was denied a UK government contract.
“Our prisoners’ hunger strike will be remembered as a landmark moment of pure defiance; an embarrassment for the British state,” the Prisoners for Palestine Group said.
Two of the prisoners who concluded their hunger strikes, Heba Muraisi and Kamran Ahmed, were on the brink of death after more than two months without food. Still, Muraisi told Al Jazeera in the days before the announcement that she felt “it’s important to fight for justice and for freedom”.
The group’s list of demands includes bail, the right to a fair trial and the de-proscription of Palestine Action as well as for Elbit sites to be closed in the UK. They’re also seeking an end to what they call censorship in prison, accusing authorities of withholding mail, calls, books and visitation rights.
Before starting to refuse liquids on Saturday, Umer Khalid told Al Jazeera: “The only thing that seems to have any impact, whether that is positive or negative, is drastic action.”
“The strike reflects the severity of this imprisonment,” he added. “Being in this prison is not living life. Our lives have been paused. The world spins, and we sit in a concrete room. This strike reflects the severity of my demands.”
Challenging the Client
A required part of this site couldn’t load. This may be due to a browser
extension, network issues, or browser settings. Please check your
connection, disable any ad blockers, or try using a different browser.
All-Region Teams for the West and Mid-West in 2025

2025 ALL-WEST/MID-WEST REGION FIRST TEAM

SARAH ANETSBERGER
Glenbrook North High School (IL)
Junior – Forward
First Team All-State
NFHCA Midwest Region First Team
MAXFH Preseason Player to Watch

VALENTINA BAIZAN
St. John’s School (TX)
Junior – Forward/Midfield
12 goals, 9 assists
All-SPC
NFHCA All-West First Team

ELLA BEACH
Glenbrook North High School (IL)
Senior – Midfield
31 goals, 13 assists
First Team All-State
NFHCA First Team National All-American
NFHCA All-Mid-West Region First Team
MAXFH Preseason Player to Watch

SOPHIA BORGHESE
Thomas Worthington High School (OH)
Senior – Forward
46 goals, 15 assists, 10 game-winning goals
All-Ohio First Team
First Team All-League
Columbus Dispatch Player of the Year
NFHCA Second Team National All-American
NFHCA All-Mid-West Region First Team
MAXFH Preseason Player to Watch

KATY CHAPMAN
John Burroughs School (MO)
Senior – Midfield
11 goals, 21 assists
Metro League Player of the Year & First Team
All-Metro Player of the Year & First Team
NFHCA Second Team National All-American
NFHCA All-Mid-West Region First Team
MAXFH Preseason Player to Watch

LILLY CIMAROLI
New Trier High School (IL)
Senior – Midfield 28 goals, 15 assists, 10 game-winning goals
State Offensive Player of the Year
First Team All-State
HFSFHA All-Conference
HSNI All-Tournament First Team
NFHCA First Team National All-American
NFHCA All-Mid-West Region First Team
MAXFH Preseason Player to Watch

ELLA CLAYTON
Sacred Heart Academy (KY)
Senior – Midfield/Forward
22 goals, 11 assists
First Team All-State
HSNI Additional Top Performer
NFHCA All-Mid-West Region First Team
MAXFH Preseason Player to Watch

LOLA CONWAY
The Bishop’s School (CA)
Sophomore – Midfield
54 goals, 25 assists
Western League Player of the Year & First Team
All-CIF San Diego Section Player of the Year & First Team
WCC Player of the Tournament
San Diego Sports Association Star of the Month
NFHCA October Player of the Month
NFHCA All-West Region
MAXFH Preseason Player to Watch
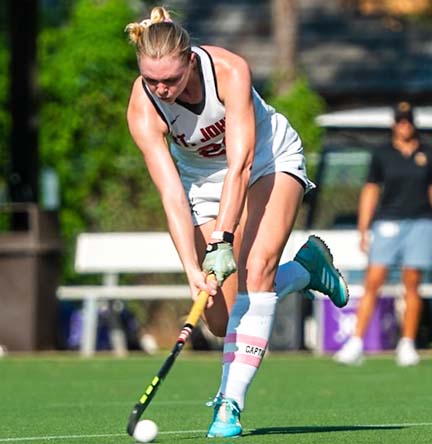
GRACEY CRAWFORD
St. John’s School (TX)
Senior – Midfield

14 goals, 8 assists
All-SPC
HSNI All-Tournament First Team
NFHCA First Team National All-American
NFHCA All-West Region
MAXFH Preseason Player to Watch

FINLEY DESLOGE
John Burroughs School (MO)
Junior – Midfield/Defense

12 goals, 16 assists
Led defense that allowed 9 goals in 25 games
Metro League First Team
All-Metro Second Team

GRACE ESSALIH
The Kinkaid School (TX)
Senior – Midfield

33 goals, 18 assists
All-SPC
NFHCA First Team National All-American
NFHCA All-West Region
MAXFH Preseason Player to Watch

MONTGOMERY FERGUSON
St. John’s School (TX)
Senior – Midfield

11 goals, 3 assists
All-SPC
HSNI All-Tournament Second Team
NFHCA Third Team National All-American
NFHCA All-West Region
MAXFH Preseason Player to Watch

KINGSLEY GOLDMAN
St. Ignatius College Prep (IL)
Senior – Defense/Midfield

2 goals, 4 assists
State Defensive Player of the Year
First Team All-State
NFHCA All-Mid-West Region First Team
MAXFH Preseason Player to Watch

ANNA CLAIRE KOSEK
Sacred Heart Academy (KY)
Senior – Midfield/Forward

36 goals, 18 assists (led state in goals & points)
Miss Kentucky Field Hockey
State Tournament MVP & All-Tournament Team
First Team All-State
Apple Tournament MVP
HSNI All-Tournament First Team
NFHCA Second Team National All-American
NFHCA All-Mid-West Region First Team
MAXFH Preseason Player to Watch
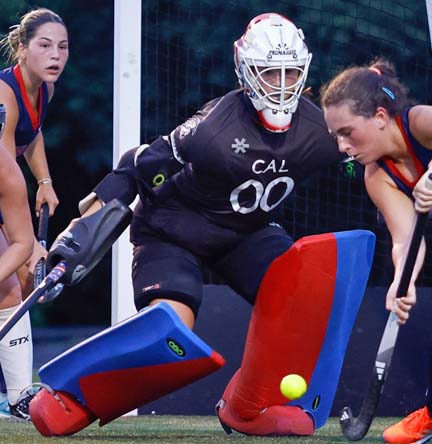
MORGAN LALA
Christian Academy of Louisville (KY)
Senior – Goalkeeper

226 saves, 39 goals allowed
All-State Tournament Team
First Team All-State
Senior All-Star Game
Apple All-Tournament Team
NFHCA First Team National All-American
NFHCA All-Mid-West Region First Team
MAXFH Preseason Player to Watch

LIBBY MCCALLA
New Trier High School (IL)
Junior – Defense

6 defensive saves, led defense that allowed .98 goals/game
First Team All-State
IHSFHA All-Conference
NFHCA All-Mid-West Region Second Team
MAXFH Preseason Player to Watch

LILLIAN MITCHELL
Dexter High School (MI)
Senior – Midfield

7 goals, 5 assists
First Team SEC
First Team All-State
MFHCA Player of the Year
NFHCA Third Team National All-American
NFHCA All-Mid-West Region First Team
MAXFH Preseason Player to Watch

JACKIE O’DONNELL
The Kinkaid School (TX)
Senior – Midfield/Defense

7 goals, 17 assists
All-SPC
HSNI All-Tournament Second Team
NFHCA Second Team National All-American
NFHCA All-West Region
MAXFH Preseason Player to Watch

MONICA PICCIOLI
Assumption High School (KY)
Senior – Defense/Midfield

13 goals, 18 assists
First Team All-State
All-State Tournament Team
HSNI All-Tournament Second Team
NFHCA All-Mid-West Region First Team
MAXFH Preseason Player to Watch
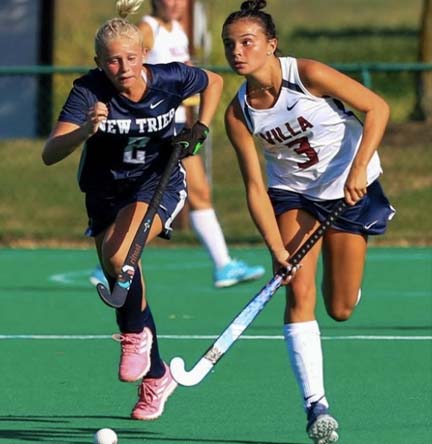
HANNAH PONCIROLI
Villa Duchesne (MO)
Sophomore – Midfield
32 goals, 17 assists
All-Metro First Team
GISL Co-Player of the Year & First Team
NFHCA All-Mid-West Region First Team

OLIVIA ROLLINS
Pioneer High School (MI)
Junior – Defense

4 goals, 2 assists
Led defense that allowed to 2 goals to MI opponents
First Team All-State
First Team SEC
NFHCA All-Mid-West Region First Team
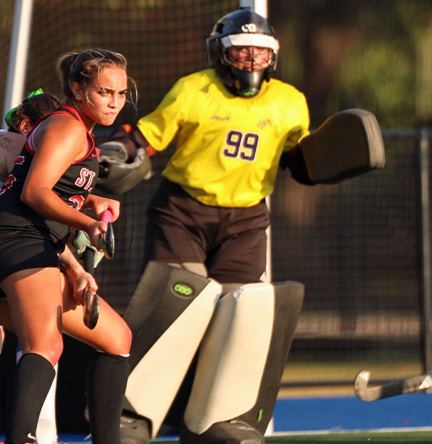
CATHERINE ROSSER
The Kinkaid School (TX)
Senior – Goalkeeper

91% save percentage, 120 saves, 12 goals allowed
All-SPC
NFHCA Second Team National All-American
NFHCA All-West Region

BLAIR STRACHAN
The Kinkaid School (TX)
Junior – Defense

20 goals, 29 assists
NFHCA Third Team National All-American
NFHCA All-West Region

OLIVIA VAN DE BRAAK
St. Ignatius College Prep (CA)
Sophomore – Midfield
17 goals, 9 assists
SCVAL De Anza Division Offensive Player of the Year
SCVAL De Anza Division First Team
NFHCA All-West Region
MAXFH Preseason Player to Watch
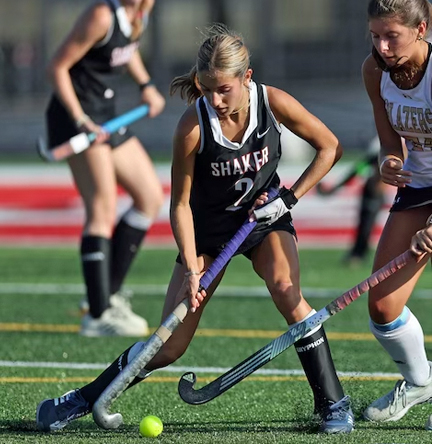
NINA YACOVONE
Shaker Heights High School (OH)
Junior – Midfield

22 goals, 28 assists
All-Ohio First Team
NOFHL Player of the Year & First Team
NFHCA All-Mid-West Region First Team
MAXFH Preseason Player to Watch
The post 2025 West/Mid-West All-Region Teams appeared first on MAX Field Hockey.
Alex Honnold successfully free solos Taipei 101 on live Netflix broadcast without safety equipment
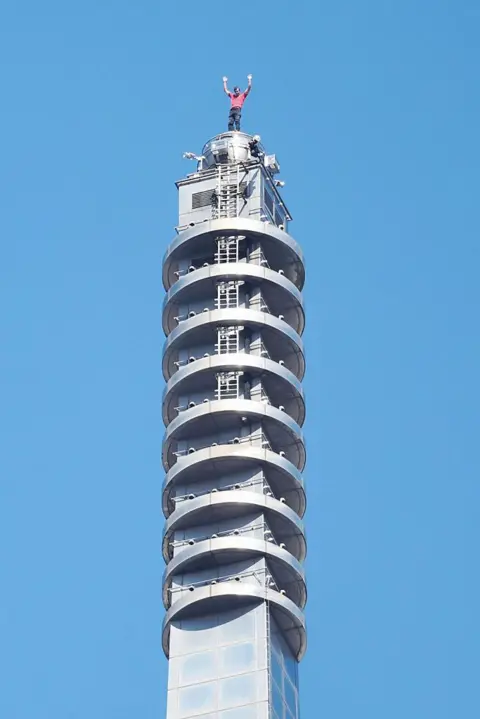
American climber Alex Honnold has successfully scaled a Taiwan skyscraper without a rope, harness or safety equipment.
The building, named Taipei 101 for the number of its floors, stands at 508m (1,667ft) of steel, glass and concrete and is designed to resemble a stick of bamboo.
Honnold is renowned for being the first person to climb El Capitan, the vertical granite cliff in California’s Yosemite national park – also without ropes or safety gear.
The climb was originally set to take place on Saturday but was delayed by wet weather.
His ascent in Taiwan’s capital was streamed live on Netflix, which said there would be a delay on the live feed should the worst happen.
Honnold completed the climb in one hour and 31 minutes and celebrated the achievement with one word: “Sick.”
His time more than halves the record of the only other person to scale the tower.
Alain Robert, a Frenchman who called himself “Spiderman”, made it to the top of Taipei 101 – at the time the world’s tallest building – in four hours. He did so with ropes and a harness.
 RITCHIE B TONGO/EPA/Shutterstock
 Getty Images
Taiwan’s Vice President Hsiao Bi-khim congratulated Honnold on the ascent, writing on X: “I admit I would probably feel sick, too, barely able to watch.”
Honnold was greeted at the top of the building by his wife, who expressed concern for the wind and heat as he climbed.
But there was another distraction during his ascent.
As Honnold reached the 89th floor, fans cheered and waved, face to face but for the window with the man clinging to the building.
Video of the moment was shared by Honnold and Netflix on Instagram, showing the climber continuing undeterred.
Honnold has made many extreme climbs during his career. A documentary about his ascent of the 3,000 foot (915m) El Capitan, titled Free Solo, won an Academy Award.
 Getty Images
 Getty Images
 Getty Images
 Reuters
Secrets of Beluga Whale Mating Reveal Nature’s Strategy
For the first time, we know more than we ever expected to know about the sex lives of the majestic beluga whale. It’s complicated, to say the least, but it also shows just how strategic nature is at keeping an isolated group of animals alive.
Research led by the Florida Atlantic University’s (FAU) Harbor Branch Oceanographic Institute have, for the first time, discovered how wild beluga whales mate – and it’s a picture of evolutionary survival.
Research Video of Alaska’s Beluga Whales
The beluga whale (Delphinapterus leucas) has been an infamously challenging species to study, even in terms of the normal difficulties in researching marine mammals. Over a massive 13 years, the scientists focused on a small whale population in Alaska’s Bristol Bay, connecting genetic information on 623 individuals as well as observing their social groups and ages. Overall, this population is made up of around 2,000 whales that are essentially isolated from any other belugas.
What they found was that their mating habits are impressively strategic. Each mature individual – male and female – will mate with multiple partners over several years, meaning they’re polygynandrous. The result is that many calves are half-siblings, ensuring genetic diversity – which is critically important in an isolated population.
“What makes this study so thrilling is that it upends our long-standing assumptions about this Arctic species,” said senior author Greg O’Corry-Crowe, a research professor at FAU. “Because males are much larger than females and appear to spend little time associating with mothers and calves, scientists believed belugas were likely to be highly polygynous, where males spend a lot of time competing for mates and only a few dominant males fathering most of the calves.
“Our findings tell a very different story. In the short term, males are only moderately polygynous. One explanation we think lies in their incredible longevity – belugas can live perhaps 100 years or more. Rather than competing intensely in a single season, males appear to play the long game, spreading their reproductive efforts over many years. It appears to be a ‘take your time, there’s plenty of fish in the sea’ strategy.”
While the boys play “the long game,” the females frequently swap mates from one breeding season to the next. The scientists believe this helps them avoid being stuck with “low quality males” and again protects genetic diversity.
“It’s a striking reminder that female choice can be just as influential in shaping reproductive success as the often-highlighted battles of male-male competition,” said O’Corry-Crowe. “Such strategies highlight the subtle, yet powerful ways in which females exert control over the next generation, shaping the evolutionary trajectory of the species.”
The researchers also found that while older females had more surviving calves than younger ones – possibly due to experience and mate choice – most adults had only a few offspring at a time. This appeared to be guided by the female’s slow reproduction.
If you’re wondering why scientists would devote more than a decade to watching whales get it on, understanding the reproductive strategies and success or failures of such an elusive, isolated group of animals is critical for protecting their numbers.
“Understanding these dynamics matters for conservation,” said O’Corry-Crowe. “If only a few males father most calves, the effective population size becomes much smaller than the number of whales actually present. This loss of genetic diversity increases the risk of inbreeding and reduces the population’s ability to adapt to environmental change. Frequent mate switching combined with low reproductive ‘skew’ and possibly the active avoidance of mating with close relatives, may be effective strategies to maintaining the genetic health of relatively small populations.”
The scientists also worked closely with the Bristol Bay indigenous communities in an effort to better protect the whales as they face a rapidly changing Arctic and sub-arctic environment.
“We cannot afford to be complacent,” said O’Corry-Crowe. “Small populations still face the dangers of genetic erosion. But we can be optimistic that beluga whale mating strategies provide evidence of nature’s resilience and offers hope for those working to save and recover small populations of any species.”
The study was published in the journal Frontiers in Marine Science.
Source: Florida Atlantic University


